2018-12-16

Analysing the transformation of a consulting unit

A case study of transformation of a consulting unit creating value in closed market for one organisation


Abstract

This paper describes a transformation of a consulting unit between 2013 and 2015 as it transformed its business model, products, customers, production methods and over half of its personnel. 

The transformation is described using a concept for consulting business architecture that focus on knowledge creation core for consulting.

Results show that the consulting unit was able to execute a major transformation relative to its history by using the tool and managing several parallel incremental changes balanced through business, culture and information management.

Introduction

This paper provides an illustrative case study of a consulting unit in the journey of transformation. The study offers two snapshots, 2013 and 2015, along with that journey. The consulting unit in the case is operating in the closed market (no price competition) providing value to one customer (contract owner) and several clients (free of charge).

This paper aims to show how business architecture approach can be used in analysing the business situation, defining the end state for a transformation and providing key performance indicators throughout the journey.

The concept for the business architecture analyses is explained in a separate paper titled “An Architecture for Consulting Business”. Therefore, this paper goes directly to the case study and its results. The analysis approaches the transformation from six different viewpoints:
  1. Business environment and forces of competition
  2. Business model
  3. Cultures within unit
  4. Maturity of Collaboration
  5. Maturity of Processes
  6. Content management.
The views of one and two provide the underlying business context. The views of three and four expose the cultural aspects. Finally, the views of five and six analyse the process and information management. In a reflection of the TOGAF 9 framework, the cultural elements are additional whereas the technical views (data, applications, infrastructure) are not included in this case study.

Change in Environment and Competition

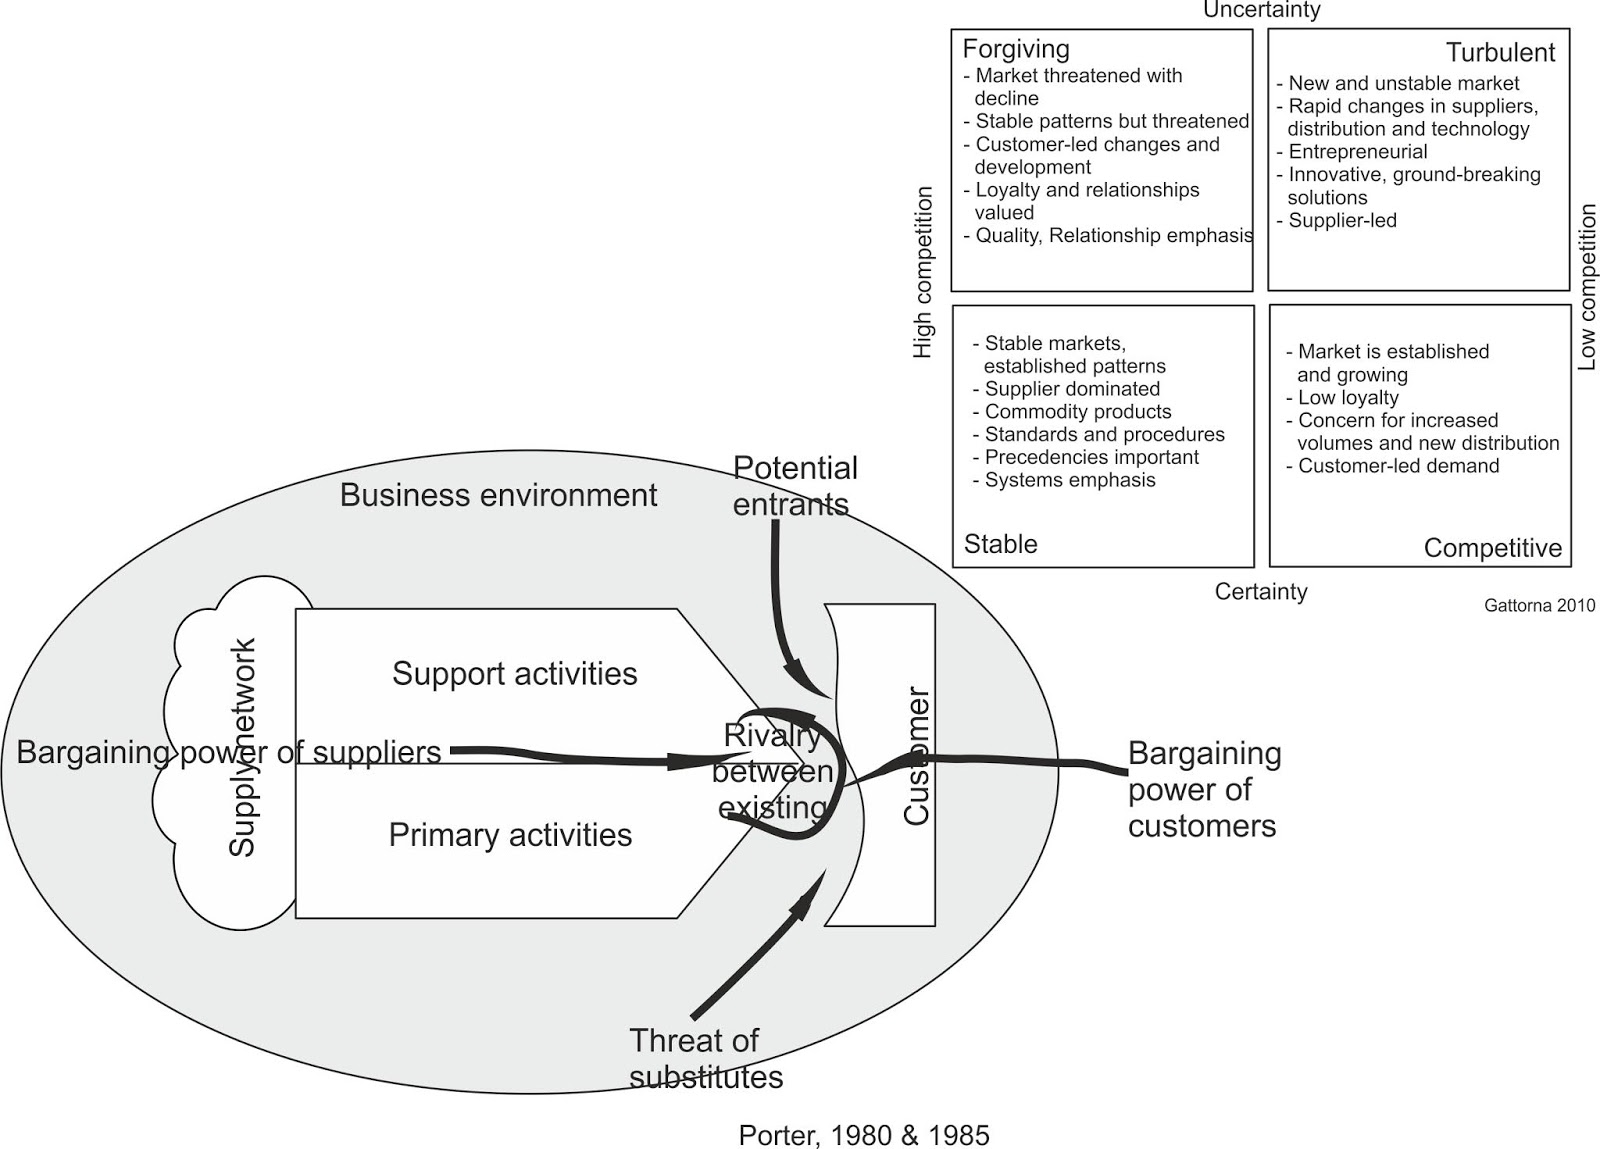
The consulting unit was enjoying a very forgiving business environment until 2013. There was a close and trusted relationship between the unit and the contract owner, who was in a senior position to order the clients to use the consulting services. During 2012 the situation changed as the contract owner altered and the new sponsor altered the rules of engagement. He required the consulting unit to provide services to each client as per need basis without authorial guidance and opened the environment for other units to compete in providing consulting. The change illustrated in Figure 1 meant that the bargaining power of clients increased. Other embedded consults became possible in the market, and there was a possibility to introduce substitutes for existing services. The business environment changed suddenly from the uncertainty of forgiving to the certainty of a competitive market.

Figure 1: Business environment and competition change in 2013

Before 2013, the unit had its consultants divided into fixed contracted tasks and similar functional groups. Each group was trying to get client commitment in their narrow areas of expertise. The business improvement was based on additional tasks that allowed the unit to hire people and create more revenue. As the mother company was making its profit based on a fixed percentage of total revenue, additional tasks were promoted heavily by management. This ended up with functionally separated consulting groups, low performing contracted tasks and aggressively growing additional tasks. When hierarchical support vanished, the old fixed groups found their clients not calling them anymore and they were struggling to create a new need for their legacy expertise.

Change in Business Model for Consulting Services

Once the change in the environment and market was understood, the consulting unit started the transformation. The first challenge was to gain the trust of the client with higher level consulting service delivered fast to meet the need and provided in a tailored manner to better fit the situation. As illustrated in Figure 2, the consulting unit decided to transform from classical consulting business model to a more flexible and scalable model.

Figure 2: Transformation of the model for consulting business

The Classical model is based on the principles of hiring talented and experiences people and providing them to clients as expertise or manpower. The optimisation of effort in this model means trying to provide as many consultants as long as possible. The client did not have much to say on the quality of talent or number of consultants engaged. During 2013, the unit had to close eight siloes of total fifteen fixed tasks.

The more flexible and scalable business model was determined to be the end state for the consulting unit. The flexibility was based on a structured process for knowledge creation including all in-house consultants. Furthermore, the unit seeks also the broader base of knowledge from a network of experts and experience. In the new model, each challenge is addressed together with a client in close co-operation applying the generic solution model but sustaining the confidentiality of the client. Value to the client is created more with knowledge transfer and providing solutions rather than embedding single experts. Furthermore, a unit established also a chain to provide information as a service through digital channels. The model builds on the strengths of different competencies, with multinational experiences to solve challenges in the more complex environment the client was facing.

Change in Organisational Culture

Since the organisational culture often nullifies all attempts to change the organisation, the analyses also included a simple chart based on the observation that humans form tribes within official organisations. These tribes tend to draw similarly feeling and motivated people together. Based on the first survey within the management and lead consultants, the starting situation included several subtribes that varied between levels one to three depending on their engagement with the client. The plan was to get the culture of the unit towards the partnership as a whole as pictured in Figure 3.

Figure 3: Situation and plan to change the organisational culture

In average the groups in the unit were defined as separate. Members of this subculture are passively antagonist. They cross their arms in judgement but never gain interest enough to make a difference. Their approach is apathetic since they have seen everything before failing. This culture does not recognise urgency or accountability. Some of the groups were observed to be personal. They think that knowledge is power thus they hoard it. They outthink and outwork their competitors on an individual basis. These people are drawn together since they best others and win being the smartest and most successful.

Since neither of the above subcultures do support well the aimed new business model, the goal for culture development was set to be at the level of partnership. This subculture has a tribal pride and always an adversary to enforce their pride — bigger the adversary, stronger the tribe culture.

Change in Collaboration Between Consultants

As part of the culture, the collaboration between talented people is one of the essential elements in consulting. Collaboration takes place both between consultants and with clients. Collaboration accelerates the knowledge creation as socialisation, externalisation and combination require collaboration between people and sources of information. The situation on 2013 appeared mostly at base level as illustrated in Figure 4: 
  • The types of information in repositories mainly were administrative and structured. There were also unstructured documents but mainly divided into task or individual level folders.
  • The scope of collaboration was to have contact between individual people. Asking advice from a colleague was not preferred act since it exposed the client relationship to “competitors” and revealed a “gap in individual knowledge”.
  • The communities were ad-hoc based on hoarding the information rather than sharing it.
  • The persistence of information was not acknowledged since it was managed at the individual level and individuals did not reveal their repositories to others. On the contrary, there was a fear that sharing their information its unreliability or outdatedness would be shown.
  • The integration points for collaboration were non-existent since there was no process to create knowledge and deliverables to clients, no one assessed their validity, but the advice was delivered mainly based on individual efforts.
  • The connectivity was between non-connected to point-to-point. The density of collaboration did not create value to the unit, groups but only to individuals.

Figure 4: The situation and plan to improve collaboration within consultants

The plan was to improve the collaboration to the level of knowledge repositories, which would create a significant advantage for flexible consulting. 


Change in Processes of Consulting

Processes allow the organisation to align the way every consultant to deliver the value and execute the business. Maturity is cumulative, which means that achieving integrated level there needs to be also aligned and local stages captured. Based on observations, the 2013 situation of process maturity in consulting unit was defined by a variety of personal methods without any unit level measures, and improvement was individualised except the administrative processes, which were following best practices and were established unit wide as described in Figure 5.

Figure 5: Situation and change in process maturity

The plan was to take the main business processes to aligned level and sustain the admin processes while making them leaner.


Change in Content management

Content management provides a base for knowledge creation and consulting business is mainly about creating new or applicable knowledge to the client. The three dimensions of content management showed that 2013 the consulting unit was in Figure 6 situation where:
  • Competencies of people were not improved but ad-hoc, security was used to prevent feared sharing, and there was no performance measuring in place for content quality.
  • The content was managed by individual people using their methods. Since there was no shared repository, folders were full of duplicates and mixture of deliverables and working files.
  • The technology was supporting document management with network storage for group work, but mainly information was stored in workstation hard disks without backup. The email was used to share documents between consultants and client deliverables were done mostly by hard copies.

Figure 6: Situation and change in content management

The plan was to take the unit to enterprise level in content management so flexible use of knowledge resources would be supported.

2018-12-03

An Architecture for Consulting Business

Introduction

Consulting is profoundly knowledge creation driven business that depends heavily on relationships between institutes and people.  The challenges that consulting at best helps to solve are more and messier  as business becomes networked, international, and products more cyber-physical . Therefore, the transformation of the consulting business should address the social challenges through the consulting value chain. Consequently, this paper provides more social and knowledge creation oriented business architecture model that illustrates the evolution of business. The aim is to provide a dynamic architecture model for an enterprise architect to analyse any consulting business and improve the success in business transformation. 

To narrow the approach, the paper focuses on a case of embedded consulting unit operating in the closed market (value, but no price competition) (Osterwalder & Pigneur). Furthermore, the approach is also emphasising the knowledge creation (Nonaka&Takeuchi)  so technology layers are not included. The paper focuses mainly on five features of the consulting business from the business and knowledge creation approach as illustrated in Figure 1:

  1. Business environment and forces of competition
  2. Business model
  3. Cultures within unit
  4. Maturity of Collaboration
  5. Maturity of Processes
  6. Content management


Figure 1: Architecture layers of this study

The framework follows the TOGAF 9.1 model but focuses on business rather than technology. Addition to TOGAF, the framework provides maturity or stage model for each layer, which helps to analyse better the roadmap this far and further towards the future.
Furthermore, the used framework introduces environment, significant stakeholders and forces of effect in the value chain. The motivation, organisation and function of TOGAF model are substituted with more granular layers of business model, organisational culture, collaboration, and business processes. The approach helps to analyse the evolutionary path of the socio-technical system and define options for its future. The information and content management model simplifies the TOGAF data architecture. Furthermore, the study does not include levels of data, application or infrastructure technology.

Business Environment and Competition

Since business is an open, purposeful system , the environment and the relationships between stakeholders affect the business model. Ackoff defines possible relationships as exploitation, cooperation, competition and conflict. The study focuses merely on competition and cooperation. The high-level business model in Figure 2 illustrating the environment and competition in the environment of business follows Porters  value chain with primary activities providing value to customers and supporting activities in helping business units or supply chains structure. The Porter’s  model for competitive strategy defines the competitive powers within the business environment. The competition model explains five forces driving the competition in the market environment:

  1. The rivalry between existing enterprises in the same market that either feels pressure or sees the opportunity to improve the position.
  2. Potential entrants may change the competition with new capacity or differentiated value. There may be barriers to entry like economies of scale, product differentiation, switching costs, access to the distribution channel, and government policy.
  3. The threat of substitute products performing the original function thus creating different value to customers
  4. Bargaining power of customers when they buy large volumes, products are standard or undifferentiated or have the full information of the market.
  5. Bargaining power of suppliers when they are dominant, there are no substitutes available, the supplier is focusing in other markets, supplier’s product is a crucial element for the value proposition.

Since the Porter model for competition does not illustrate the degree of certainty or maturity, a model from Gattorna  helps to model the degree of certainty of the market. The two dimensions of competition and certainty define a quadrant showing:

  1. Stable market when competition is low, and certainty is high.
  2. Forgiving market when competition is low, but the market is on the move (probably decline).
  3. Competitive market when competition is high, but rules have matured, and expectations are quite confident.
  4. Turbulent market when competition is high, but the possibility of changes is high which makes the market more uncertain.


Figure 2: Environment and Competition in Consulting Business

Business Model

The business model (Osterwalder and Pigneur) explains how value is proposed to customer segments, delivered via channels and ensuring continuation through customer relationship. The value is created with critical activities using resources from in-house and main partners. Financial dimension includes revenue streams, cost structure, and value chain relationships as illustrated in Figure 3.

Figure 3: a generic value creation model

The customer segments define the different groups of people or organisations a business unit aims to reach and serve. The segments may be differentiated by:

  • Mass-market which focuses on one large group of customers with broadly similar needs and problems.
  • A niche market has specific and specialised customer segments. Each segment needs tailored proposition, distribution and customer relationship.
  • In a segmented market, several groups of customer provide business with slightly different needs and problems. The same business unit may provide value to each segment from the same line of production if channel and customer relationship tailor the proposal according to each segment.
  • The diversified market is a model where one business unit proposes value to two or more separate customer segments.
  • Open or closed market defines whether there is competition in the market, or it is a monopoly or controlled by market authority.


The value proposition describes the bundle of products and services that create value for an individual customer segment. Values may be quantitative (price, the speed of service) or qualitative (design, customer experience) and are differentiated by their:

  • Newness which will satisfy the entirely new set of needs that occurred recently to customers.
  • A performance which will improve the perception of value because with same price there will be more benefits
  • Customisation which will address the specific needs of a customer. This includes mass customisation and customer co-creation.
  • “Getting the job done” will help the customer to achieve her tactical goals.
  • The design will provide a product that stands out from others because of its looks, package, features, or interface.
  • Brand/Status provides value by merely using and displaying the brand
  • The price where the lower price will differentiate the product from regular market prices. Free offers can be used either for claiming market shares or with a different revenue model.
  • Cost reduction when helping the customer to reduce their costs and therefore improve their revenue.
  • Risk reduction is appreciated if the proposition is lessening the risk in further use of a product (availability guarantee, service guarantee, insurance, service-level guarantee). 
  • Accessibility is a value when products are delivered to customers with no previous availability.
  • Convenience/Usability is substantial value if services are easier to use, convenient to acquire or better replaced when broken.


Channels describe how business unit communicates with and reaches its customers to deliver the value proposition. Channels may be direct or indirect and also owned or partnered. Channel is building following the phases of:

  • Awareness addresses the challenge in raising the knowledge among the customers of the available value proposition. 
  • The evaluation aims to help the customer in assessing our value proposition 
  • Purchase aims to support the customer in buying/ordering our products or services
  • Delivery takes our products or services to the customer in need
  • After sales support the customer in post-purchase situations.


Customer relationships describe the types of relationships unit establishes with each customer segment. Customer relationships may be driven by customer acquisition, customer retention or boosting sales. It is measured by the overall customer experience. Customer relationships may be established through:

  • Personal assistance provides human interaction through the process of value proposition and delivery (point of sale, call centres).
  • Dedicated personal assistance provides a dedicated account manager to an individual client and possibly develops over time to most profound and intimate relationship (key account manager, own doctor, local store personnel, barber).
  • Self-service provides all necessary means for customers to help themselves.
  • Automated service is more sophisticated self-service with automated processes and individualised support (AI drove service centre, service robot).
  • Communities like user community provide peer support when using similar product/service (user groups, sports groups, patient groups).
  • Co-creation invites customers to participate in the design, production and improvement of products (reviews of the product, immaterial content production, hackathons).


Revenue streams represent the cash flow a unit generates from each customer segment. There are two types of streams: 1. transactions revenues from one-time customer payments, and 2. Recurring revenues from ongoing payments either to continuously deliver value or provide post-purchase support. Revenue streams can be generated from:

  • Asset sale means selling ownership of a product.
  • The usage fee is generated using a service.
  • Subscription fee comes from selling continuous access to a service.
  • Lending/Renting/Leasing revenue comes from temporarily granting some the exclusive right to use an asset for a fixed period in return for a fee.
  • Licensing creates revenue when the customer is permitted to use protected intellectual property in exchange for licensing fee.
  • Brokerage fee is collected from intermediation services performed on behalf of two or more parties.
  • Advertising creates revenue when unit market/advertise a product, service or brand.


Key resources describe the most important assets required to make the business work. These resources allow the unit to create, offer and deliver a value proposition, reach markets, maintain relationships and earn revenues. Resources may be owned, leased or acquired from main partners. The primary resources may be:

  • Physical assets such as manufacturing facilities, machines, distribution networks, or point-of-sales systems. 
  • Intellectual assets such as brands, proprietary knowledge, patents, copyrights, partnerships or customer information.
  • Human assets as competent people that can work together, for example, creating innovations or new knowledge.
  • Financial assets as cash, lines of credit, or stock options.


Key activities describe the most important things the unit must do to operate successfully. These activities may be:

  • Production relates to design, making and delivering a product
  • Problem-solving relates to advising, training, knowledge transfer or just fixing customers problem. Activities include knowledge management and continuous training.
  • Platform/Network may be built on networks, social channels, software, or brands. Activities include platform management, service provisioning and platform promotion.


Key partnerships describe the network of suppliers and partners that make to business model work. There may be four types of partnerships:

  1. The strategic alliance between non-competitors
  2. Coopetition which is a strategic alliance between competitors
  3. Joint ventures to develop new business
  4. Buyer-supplier relationships to assure reliable supplies.

The partnerships are mostly motivated by:

  • Optimisation and economy of scale when it is not cost-efficient for a unit to own all key resources or perform every activity by itself. Outsourcing enables the supply chain to specialise and gain economy of scale.
  • Reduction of risk and uncertainty especially when developing and bringing new technology in a competitive market or sharing the R&D costs of a high-value product.
  • Acquisition of resources and activities is typical in modern value chains where products are complex and require significant development investments.


Cost structure describes all costs incurred in operating the business. The cost structure may be driven by the following approaches:

  • The cost-driven approach seeks to create and maintain the leanest possible cost structure using low price proposition, automation, and outsourcing.
  • The value-driven approach seeks to maximise the customer value with the premium proposition, personalised services and risk minimising post-purchase.

Cost structures may be characterised by:

  • Fixed costs include costs that remain the same despite the volume: example salaries, rents, physical machines and facilities.
  • Variable costs are those that proportionally vary with the volume of goods produced.
  • Economies of scale advantages may be gained from the suppliers as unit’s output expands
  • Economies of scope advantages may be gained when same activities are used to support different segments.


Value chain relationships describe the types of relationships unit establishes with each supplier or partner. Vendor relationships is measured by the overall revenue of the value chain and driven according to Gattorna  by:

  • Continuous replenishment fulfils predictable demand and focus is on retention of the customer relationship.
  • Lean fulfils constant but loosely related demand and focus is on gaining efficiency. 
  • Agile supply chain fulfils unplanned or unforeseen demand, so supply chain reacts with the swift response and higher cost-to-serve. The focus is on the service-cost equation.
  • Fully flexible chain responds opportunistically and manages the yield. The focus is on providing creative solutions for a premium price.


The architect uses the above business canvas to define existing model for consulting business and collects the future intentions indicating the needs for transformation. Furthermore, the architect analysis the stage of consulting using the types described in the following subsection.

Variations in Consulting Business Models

For specific consulting business the model uses Sniukas’s  approach for reinvented consulting business. He defines six specific business types for consulting pictured in Figure 4: 1. Classical, 2. Brokering, 3. Information, 4. Solutions, 5. Objective driven, and 6. Flexible. 

Classical consultation business is based on two principles: 
1) Hiring talented and experiences people;
2) Charging clients the usage per time of this talent, expertise, or workforce.
The classical model optimises the sale of as many consultants per time as possible. The client does not have too much choice for talent or number of consultants engaged.

Brokering top talent is a business where the consulting company does not hire consultants but provides access for clients to available freelance competence. Clients choose from the available consultants their preference. As clients become more expert in using the consultants, more value is provided. Consultants are not in pressure of selling new projects, so they can concentrate on providing successful projects. Lower overhead cost translates to lower fees, trusted talent, and focused contribution.


Figure 4: Variations of approach in contemporary consulting business

Providing information and analysis of top experts is a model where consultants are not meeting with a client but provide standard reports, analysis, trends and other knowledge goods to the client per-content basis. Consultant work is researching and publishing. Publishing happens via portals, blogs, or other digital means. Besides off-the-shelf reports, there may also be customised reports provided to a type of challenge. New products and clients can be created quickly with flexible consultant teams, who are working together for quality knowledge.

Providing solutions means that there is a structured, repeatable and standardised process in solving the challenges that clients are facing. There might be tool and method development for quantitative research to enable the quick delivery of results. Licensing these tools to clients may also be a stream for revenue.

Objective driven consulting changes the pricing policy in the business. Only 1/3 of charge is based on fixed prices and rest is dynamic based on successful delivery. The risk of consultation is divided between provider and client. This motivates consultants to innovate and seek more creative solutions for clients’ challenges.

Flexible and scalable business model for consulting is somewhat a combination of the previous. There is a structured process for knowledge creation within in-house consultants, but there is also a more extensive network of experts and experience available for solving challenges. Each challenge is addressed together with a client by assigning a tailored team and consulting service. The solution is found in close cooperation sustaining the confidentiality of the client. Value is created more with knowledge transfer and solutions rather than manning projects. Generic information as a service is also a part of the service portfolio. The model attempts to integrate trusted people with broader competency and expertise into the same team, so both logical and social needs are met.

Organisational Culture

After assessing the business model in the previous sector, analysing the social structure and relationships within an organisation and through the value chain becomes the next challenge. The Logan et al.  model of tribal subcultures defines simple stages and paths for cultural analyses and roads for improvement. The cultural categorising is based on a concept that human beings form tribes, i.e., teams within an official organisation. These tribes tend to draw similarly feeling and motivated people together, and there is a pattern of stages defined in improving the maturity of the culture illustrated in Figure 5.

Figure 5: Five different subcultures that can be found in an average organisation

Members of the 1st tribal subculture are despairingly hostile. They band together to get through a perceived world of violence and unfairness. Their shared feeling may laud as “Life Sucks”. About 2% of professionals in the US operate here at any given point.

Members of the 2nd tribal subculture are passively antagonist. They cross their arms in judgement but never engage enough to make a difference. Their feeling is apathy since they have seen so many failed attempts. The culture does not recognise urgency or accountability. Their slogan reverence as “My Life Sucks”. About 25% of organisations in the USA have pockets of people belonging to this subculture.

Members of third tribal subculture think that knowledge is power. Therefore, they want to possess and hoard it. They outthink and outwork their competitors on an individual basis. These people are drawn together since they beat others and win being the smartest and most successful. About 49 % of workplaces in the US belongs to this “I am great, and you are not” stage.

Members of fourth tribal subculture think that “We are great, and they are not”. There is a tribal pride and always an adversary to reflect their greatness — bigger the adversary, more powerful the tribe culture. About 22% of workplaces in the US are in this stage. The most usual way to create a successful organisation is to create enough teams with this subculture together and then show them adversary worth the fight.

Members of fifth tribal subculture have a feeling that “Life is great”. These teams are going to make history because they have a cause bigger than themselves or anyone else. Most successful organisations do not stay in this stage but alter between 4 and 5. Less than 2% of organisations in the US have evidence of this stage.

Culture can effectively deny many intended, logical changes of the future business model. Therefore, the architect needs to define the area of cultural stages the consulting unit resides. Longer the value chain for knowledge creation is, the less successful consultants at cultural stages of first and second are. More complex the challenge and more stakeholders are included, further, between levels four and five, the consulting team needs to be. 

Degree of Collaboration

After the coarse analysis of culture explained above, the architect needs to focus on the core feature in Nonaka and Takeuchi  model of organisational knowledge creation - collaboration and cooperation. Collaboration and cooperation between talented people are essential in knowledge-intensive consulting, whether collaboration happens between consultants or with clients. Collaboration accelerates knowledge creation as socialisation, externalisation and combination require cooperation between people and sources of information. The study uses the Synapticity collaboration maturity model illustrated in Figure 6 because of its simplicity with four stages but the richness in six dimensions.

Figure 6: A simple maturity model for collaboration within an enterprise

The four stages create a roadmap for maturity in collaboration:

  1. Base level describes point-to-point individual level collaboration
  2. Tools oriented describes more function-oriented collaboration
  3. Knowledge repositories introduce cross-domain collaboration
  4. Collaboration and interaction introduce wider society, tribal collaboration.

Each stage is defined by six dimensions or features:

  • Information Types: Is the conveyed information unstructured, structured, referential, rich, or media based?
  • Scope: How many people and how they are affected by collaboration? One-to-one interaction, roles based, task-based or self-defined communities.
  • Communities: How collaboration is changing the culture? Hoarding information, we have all the information, small sharing groups or dynamic community of collaboration that shape per each interest.
  • Information Persistence: How relevant the communicated information is? Life cycle, consumption means, exposure to different users.
  • Integration Points: How much collaboration is interacting with other means of sharing information and ideas? Is security mature enough to stand integration? How are standards used in creating integration links?
  • Connectivity or Density: Improves from non-connected to full connectivity and multiple connections.  Density increases as hubs and outliers are bringing value to society and knowledge creation process. 


The above model provides architect an assessing tool that helps to define how the consulting unit reached the current situation in the maturity of collaboration and possible guidance on how it may be improved.

Processes of Consulting Business from the Knowledge creation approach

Processes or chain of functions allows an organisation to align the way to create value for the customer.  The ThinkingProcess  provides three dimensional model for process, performance and improvement maturity and follows the stages of classic CMMI-model : 1. Ad hoc, 2. Local, 3. Aligned, 4. Integrated and 5. Optimised. The maturity model for processes illustrated in Figure 7 is cumulative, which means that achieving the upper stage, the organisation needs to master also the features of previous stages.

Figure 7: Model for consulting process maturity

The process dimension matures as processes are defined, followed, extended, and they start to provide direct feedback for continuous improvement. The performance dimension matures as measuring and feedback is improving and creating closer loops of iteration. The feedback loops include both operational and strategic key performance indicators. The improvement dimension matures as development becomes more controlled and value-driven approach starts getting rid of waste gradually through the whole value chain.

The tool provides architect not only a maturity model for business functions but also a view for the value stream improvement and performance. The approach ensures that business architect considers establishing a continuous improvement rather than guides towards project aimed change.

Information and Content Management

Finally, the content management provides a base for knowledge creation in consulting. Cameron , in Figure 8, defines content management through systems, processes and people. He does not follow the CMMI maturity model but introduces stages of maturity through social connections and extends the path of maturity with development by optimisation and innovation.

Figure 8: The dimension and stages of content management in consulting business

The people dimension includes human itself but also support, competence, training, relationship to risk and reward and performance management. There is also an organisational culture aspect, but it is assessed better in previous culture oriented models.

The processes in this model focus only on information or content management functions. They have different forms as standards, guidelines, policies, records, and workflows. The content management processes are analysed based on their: 

  • Relevance: why information is relevant, 
  • Retention: what information needs to be recorded and what destroyed
  • Timing and throughput: when information needs to be acted upon
  • Responsibility and contribution: who manages information effectively.


The systems include hardware, software and applications which are used create, store and manage information. The technical part of content management is measured by:

  • Retention: where information needs to be kept
  • Timing and throughput: when and whether information can be processed
  • Responsibility and contribution: who is managing information and when
  • Ubiquity: where and when information is being accessed
  • Analysis and meaning: how to help interpret, create and manage information.


Conclusion

The business of consulting becomes more messier as it evolves towards networked, international and cyber-physical. Since the TOGAF model does not directly address the ways to describe the evolutionary nature of consulting business, this paper creates an applied architecture model for assessing the past and future roadmap for consulting business.

The model for consulting business explains how to analyse the environment and five interconnected layers of business architecture. The model answers the questions of: 

  • Where the business has evolved to current situation and 
  • What opportunities or challenges it faces when developing towards the future?

The model addresses specially the knowledge creation and social aspects of consulting business, which are substantial in consulting business.

The model is only presented in this paper. Other publications test the model and proof its feasibility. The focus of this model is in knowledge creation and business architecture. Therefore, all technical structures are left out from architecture considerations.

2018-10-02

Prepare Your Encryption for the Era of Quantum Computing

Encryption and Computing Performance

Legacy computing uses binary digits and, even with doubling the computing performance every 18 months, it is believed to take 70 years to break AES256 encryption with a standard approach to computing.

Quantum computing uses quantum bits, which enable the computer to perform multiple calculations simultaneously. Thus, the probability of having AES256 enciphered much faster the primitives using Shor's factorisation quantum algorithm than with standard computers. It is believed that Quantum computing is still 20 years ahead, but governments may gain the ability earlier, even within three years’ time.

Threat cases

“If someone were to record that communication now, in three years’ time a quantum computer comes along, then they can decrypt that communication and make money from the credit card details.” 

“The flaw of the Public Key Method is that the message and the private key travel together, so if you have enough processing power you can work out the key and compromise the data.”

“Instead of relying on prime-factor based methods for encrypting data, post-quantum encryption uses techniques that have been described as quantum-resistant”.

Mitigation

  • Gain understanding what encryption methods your units are using. Be at least sure that all used encryption complies with SHA 2 requirements.
  • If possible, extend the key length of current public key encryption.
  • From now on, start acquiring encryption devices that support automation upgrade of encryption algorithms.
  • Use Secret key algorithm (symmetric algorithm) that uses the same key for both encryption and decryption. That key is distributed other ways, sometimes out-of-band, so if the key remains secret and there is no access to both plain and encrypted text.
  • Start testing new algorithms like:
  • Grover’s Algorithm may stand against Quantum speed of unstructured searching and provide an amplitude amplification to existing algorithms.
  • Lattice-based cryptography solutions

References

1. https://www.computerweekly.com/feature/Prepare-now-for-quantum-computers-QKD-and-post-quantum-encryption?src=5798104&asrc=EM_ERU_101142323&utm_content=eru-rd2-rcpF&utm_medium=EM&utm_source=ERU&utm_campaign=20181001_ERU%20Transmission%20for%2010/01/2018%20(UserUniverse:%202637481)
2. https://searchsecurity.techtarget.com/tip/How-lattice-based-cryptography-will-improve-encryption

2018-09-15

How to Apply Artificial Intelligence in Military Affairs – A Business Analysis Example at Tactical level

The article explains the features of Artificial Intelligence (AI) feasible to military, analyses a process of tactical Command and Control, and considers how Artificial Intelligence may improve tactical-level command and control. 

The approach for this analysis is an evolutionary, i.e. gradual improvement and not revolutionary, i.e. creating a new way of military affairs. The improvement analysis process runs as follows:

  1. Define the military system of systems, environment and areas of Artificial Intelligence under the consideration
  2. Recognise the primary process to be enhanced and its connection to measurable military capabilities
  3. Recognise the questions or problem types where AI may make a difference and link them to a chosen process for improvement
  4. Retrace the AI features back to capabilities and create a link between AI features and expected measurable benefits
  5. Consider the constraints of existing data, systems to embed the AI and cultural readiness to adopt AI featured solutions.


1. Target Definition

The section below defines the military system of systems, its environment and focuses on the area where Artificial Intelligence effects are studied.

1.1 Area of focus in a military system of systems

Military affairs are a part of confrontation and conflict between societies. The culture, religions and technologies the societies are applying also reflect military structures and affairs. Recently, western societies have been transformed by opportunities created by digitalisation and social media. Now, there are concepts like smart governance, social business, industry 4.0 and artificial intelligence providing new opportunities to develop functions.  This study chooses to analyse a military enterprise facing new opportunities created by the Artificial Intelligence. Furthermore, the research focuses on the capabilities of military force utilisation at the tactical level as illustrated in Figure 1.

Figure 1: Contemporary context for military affairs and system of systems

At the tactical level, the military (BLUE) is focusing on gaining a victory over the adversary (RED) in combat. BLUE intends to create a combined effect through all three areas of effect in the RED’s socio-technical system: Moral, Mental and Physical as presented in Figure 2.  In the physical area, the ways of tactics are manoeuvring the troops to create an advantage, massing the effect to produce enough casualties, having the firepower to overcome the means of defence, and applying everything in tempo that the RED cannot recover at the mental level. In the mental area, the ways are a deception to mislead RED’s expectations, surprise to catch RED unprepared, confusion to slow down RED’s sensemaking, and shock to scatter RED’s moral cohesion. In the moral area, the cohesion of RED’s moral is the key to victory. When the moral cohesion starts rumbling down, and there is no time to rebuild it, the BLUE success is granted. 

Figure 2: Tactical essentials in Blue and Red confrontation

Since the success at tactical level combat is significantly dependent on the human decision making, this study tries to find an answer to how artificial intelligence may improve the human command and control process to gain a better advantage in the battlefield.


1.2 Areas of Artificial Intelligence to consider for an improvement

The study focuses on recent developments in AI related technologies and data science. The significantly improved features illustrated in Figure 3 are: 

  1. Automation leading to autonomous systems, robotics and automated processes
  2. Human Machine Interface is connecting Human with machines through Natural Language Processing features more intuitional way than the legacy keyboard and joystick.
  3. Analytics in making sense of large and complex sets of structured or unstructured data
  4. Image recognition in detecting and identifying patterns and meaningful “images” from pictures, videos, radar, sonar, SIGINT, handwriting, etc.


Figure 3: The four recently developed areas in AI related features

The study focuses on AI analytics application in military command and control at the tactical level, especially in the land battle scenario.


2. Essential Tactical Capabilities and Functions Inclined to Enhancement by Features of Artificial Intelligence

The section below recognises the primary decision-making process to be enhanced using artificial intelligence and links the process to tactical capabilities. The OODA -model by John Boyd is a most straightforward description of the human decision-making process in a tactical situation. The functions of Observe, Orient, Decide and Act are linked into essential tactical functions chosen from the model introduced by B.A. Friedman.


2.1 Human process for commanding and controlling

The OODA -model in this study is simplified to a loop rather than the original meta-paradigm and systems model. The simplification is done to keep this study focused on the four functions of the OODA loop  illustrated in Figure 4 are:

1. Observation: By observing and considering new information about our changing environment, our minds become an open system rather than a closed one, and we can gain the knowledge and understanding that’s crucial in forming new mental models.

2. Orientation: “orientation shapes the way we interact with the environment…it shapes the way we observe, the way we decide, the way we act. In this sense, orientation shapes the character of present OODA loops, while the present loop shapes the character of future orientation.”  There is a twofold process included here:
  • Destructive deduction process analyses and pulls apart existing mental concepts into discrete parts. This is to define the constitutive elements.
  • Creative induction uses these constitutive elements to form new mental concepts that more closely align with what we have observed is really happening around us.

3. Decision happens when actors decide among action alternatives generated in the Orientation phase. The decision is essentially moving forward with a best possible hypothesis — best “educated guess” — about which mental model will work.

4.The action includes multiple parallel actions/tests/experiments going on at the same time so that you can quickly discover the best mental model for a situation. In battle, this might mean having multiple attack points that are using different weapons systems. When the commander determines which targets and weapons are providing the best results, he’ll direct his attention to the winning mental model and mass it to the max until it no longer works. Once the commander observes that it is no longer effective, he’ll orient more mental concepts, decide to use one or several of them, and quickly act to test them out until the enemy reacts in an intended manner.

Figure 4: Essential OODA-loop modelling the command and control process of a battle commander

The above-described loop is modelling the human behaviour of a battle tank commander. The study uses the model to present how the command and control functions link into essential tactical functions to create an effect on the adversary. Next section will illuminate these tactical essentials and study their causality in reference to OODA functions.


2.2 Essential tactical functions used in this study

From the list of three tactical areas of effect and together nine ways applied in battle tactics , this study chooses the following to keep the model simple:

  • Deception in combat is the manipulation of the enemy’s understanding of the situation to achieve an advantageous position. The tactician misleads his enemy by false image and hides his real intention to create surprise and shock to his enemy. 
  • Manoeuvre means attacking an enemy force from a position of comparative advantage. Manoeuvre is any asymmetry that provides the spatial or functional advantage that the enemy is not adept at countering. Forms of manoeuvre are for example frontal attack, flanking attack, envelopment, turning movement, infiltration, and swarming.
  • Mass is an advantageous concentration of combat power or effects in space and time. Massing is to achieve local and timely superiority using the combined arms effect.
  • Firepower is the ability to detect, engage and take down the target. Firepower can be mitigated by dispersal, cover, concealment, and armour. In the modern battlefield, the combined arms firepower is essential to overcome the advantages and disadvantages of the enemy’s weapons.
  • Tempo is the ability to control the pace of combat to your advantage and the disadvantage of the enemy. Both sides are affected by the friction of war, and this entropy of troops can be magnified by deception, attrition and the ability to decide faster. Principally, both the quickening and slowing down can be used for tactical advantage.

2.3 Mapping the command and control to tactical combat essentials

Mapping the human functions of the OODA loop to essential tactical functions will provide the points of effect when considering enhancing human performance with AI features. The mapping is done using the question method by Marr  to reveal the need of understanding in combat command and control. The next table 1 provides samples of crucial questions where AI may give a better understanding and a difference in human cognitive performance in a tactical situation.
Table 1: Assessing the points of effect when OODA loop is applied in tactical battle


Observe
Orient
Decide
Act
Deception
What is happening outside of the focus area?
What is RED’s normal doctrinal behaviour?
What may RED do in scenario A?
Fastest reserve available
Manoeuvre
What is moving over time?
Estimated time to approach a point
Which routes give the best approach?
Are BLUE units on time?
Massing of effect
Coordination of time of arrival
Which are the points of effect on RED’s system?
Optimising the effect and firepower
Is the massing of effect getting to RED’s breaking point?
Firepower
Detecting targets
Identifying and prioritising targets
Identifying and taking down targets
Is BLUE taking down targets fast enough?
Tempo
How is the BLUE doing?
How is the RED doing?
What is the average pace of BLUE and RED in this terrain/ situation?
Optimising the time of decision
Changes in the tempo of both sides
Table 1 will be revisited when the AI features linked to OODA functions are retraced to essential tactical capabilities.


3.Problem Types Where Artificial Intelligence Makes Difference

In quest of not diving too deep into AI technologies, this paper uses McKinsey defined problem types  where AI has been observed to make a difference in real-world cases. When robotics and machine vision oriented solutions are deducted, the following seven types of problem types can be supported by features of AI:

1. Searching

  1. Searching for content, routes, answers, or combinations. Searching is an AI-enhanced function that continually evolves in identifying, sorting, and presenting the data that is most likely to meet the needs of users at that specific time, based on a multitude of variables. 
  2. Answering questions like:


  • What does “this” mean? Google RankBrain embeds written language into vectors that can indicate the closeness of phrases. Thus Google search gives also related content not only keyword matches. 
  • Navigational Queries: Who is this agent? Which domain does this content come? Where is this location? How do I get to this location?
  • Informational Queries: What happened in this location at this time? What is ongoing at this location now? What is planned to occur in this location?
  • Intentional Queries: Who is selling/buying this item? Who is heading to this location? Who is planning to deploy to this area?
  • Transactional Queries: Pay a bill! Purchase an item! Order supply! Publish the report!


2. Classification and anomaly detection

  1. Classify new inputs as belonging to one of a set of categories (trained or determined). Based on history, determine whether new inputs are within normal or anomalies.
  2. Answering questions like:


  • Does the received image contain a specific type of object?
  • Are we driving along the lane?
  • Is the traffic light red, orange or green?
  • Which RED transceiver does this signal belong?
  • Does this event fall into the typical area of behaviour or is it an anomaly?
  • Is this new information or update to an old piece of info?

3. Continuous estimation

  1. Predict the time series. Estimate the next numeric value in a sequence.
  2. Answering questions like:


  • How long can the RED continue firing the current way if we know their organic supply? 
  • How long does the fuel will last if BLUE continues driving the current way?
  • When the BLUE needs its resupply if they continue fighting this way?
  • How many sorties can this BLUE fighter fly before the engine needs to be changed?

4. Clustering

  1. The system creates a set of categories, for which individual data instances have a set of standard or similar characteristics.
  2. Answering questions like:


  • What do 60-65 year old people buy for Eid celebration?
  • Do these RED units belong to the assumed official organisation?
  • Do these tracks belong to which RED fighting vehicle?
  • Is the recorded event normal or abnormal?
  • Is the transmitter signal captured new or already appeared in AOO?
  • Would the RED commander prefer A or B option based on anthropological, psychological and doctrinal data?

5. Optimisation

  1. The system generates a set of outputs that optimise outcomes for a specific objective function.
  2. Answering questions like:


  • What is the optimal route from A to B if we need to reach there as soon as possible sustaining 2/3 fuel reserve?
  • If we have only one Recce patrol, which route would be safest but quickest to get them to point B within the next 2 hrs?
  • If RED wants the optimised effect on our troops with their artillery, which areas they may deploy their batteries?

6. Ranking

  1. Results of a query or request need to be ordered by some criterion.
  2. Answering questions like:


  • Which RED manoeuvre is the most probable in this situation?
  • In which order should BLUE use its reserves to create 10% losses to RED troops?
  • What priority should BLUE use fires to cause over 30% losses when facing RED troops?

7. Recommendation

  1. systems are suggesting next step sorting options by relevance, probability, feasibility or availability before presenting the results to the user.
  2. Answering questions like:


  • What may this customer buy next, based on the buying patterns of similar individuals?
  • If RED is manoeuvring his armoured task force this way, what are his next options to engage BLUE troops?
  • If the RED commander is walking like this, how well he can sustain in 24/7 intensive operations?
  • If RED positions their artillery here, how long they can sustain fire to this far?
  • How trusted this source of information is based on past deliverables?

The above list defines the taxonomy for generic problem types that AI is feasible in solving. The slight military flavoured examples help architects to apply the taxonomy in military command and control process improvement in following sections.
Furthermore, when the design is conducted, there is a need to map the military problems into possible AI algorithms plausible for types of general problems. The following Table 2 provides one view for problem types and likely AI sampling techniques.

Table 2: Generic problem types and plausible AI sampling techniques 
Generic problem type
AI sample techniques
Searching
Brute force search, Breath-First search, Depth-First search, Bidirectional search, Iterative Deepening Depth-First search, heuristic searches, Local searches [1]
Classification
CNN, Logistic regression
Anomaly detection
One-class support vector machines, k-nearest neighbours, neural networks
Continuous Estimation
Feed forwards neural networks,  linear regression
Clustering
K-means, affinity propagation
Optimisation
Generic algorithms
Ranking
Ranking support vector machines, neural networks
Recommender
Collaborative filtering


4. Finding AI Features to Improve OODA

The taxonomy of generic problem types helps to map the previously analysed tactically essential OODA questions from Table 1. The questions about improving OODA functions can be linked to AI problem types as presented in Table 3. This linkage provides a view to applying AI algorithms into the command and control process.

Table 3: Mapping AI features to improve OODA loop

Observe
Orient
Decide
Act
Searching
Detecting targets
What is RED’s normal doctrinal behaviour?
What is the average pace of BLUE and RED in this terrain/ situation?

Fastest reserve available
Classification, Anomaly detection
What is happening outside of the focus area?
Identifying and prioritising targets
Identifying and taking down targets.
Changes in the tempo of both sides
Continuous estimation
How is the BLUE doing?
How is the RED doing?
Estimated time to approach a point

Are BLUE units on time?
Is the massing of effect getting to RED’s breaking point?
Is BLUE taking down targets fast enough?
Clustering
What is moving over time?


Changes in the tempo of both sides
Optimisation
Coordination of time of arrival

Optimising the time of decision.
Which routes give the best approach?

Ranking

Identifying and prioritising targets


Recommendation

Which are the points of effect on RED’s system?
What may RED do in scenario A?


The mapping in Table 3 indicates that the AI features may improve the human performance in OODA loop. Since the mapping of AI technical features and functions of command and control process, Table 3 is an essential artefact to keep alignment between business and technical architects.


5. Retracing AI Enhances in OODA Back to Tactical Capabilities

The previous sections explain how to redact the military capabilities to a level where AI features can be introduced. Now follows the reasoning that deducts the possible technical enhancements back to higher tactical level capabilities. Taking the mapping done in Table 3, the architect can retrace the potential impacts of AI back to Table 1 essential capabilities of a tactical battle. Table 4 presents possible AI features that may affect tactical capabilities. The deduction helps the architect to reason the potential enhancements to owners of operational capabilities and possible investment decisions while maintaining essential metrics for implementation planning and user acceptance tests.

Table 4: Example of AI enhanced features and benefits in tactical battle

Observe
Orient
Decide
Act
Deception
What is happening outside of the focus area?
Classification/
Anomaly Detection
What is RED’s normal doctrinal behaviour?
Searching
What may RED do in scenario A?
Recommendation
Fastest reserve available.
Searching
Manoeuvre
What is moving over time?
Clustering
Estimated time to approach a point.
Continuous Estimation
Which routes give the best approach?
Optimisation
Are BLUE units on time?
Continuous Estimation
Massing of effect
Coordination of time of arrival
Optimisation
Which are the points of effect on RED’s system?
Searching,
Recommendation
Optimising the effect and firepower.
Optimisation
Is the massing of effect getting to RED’s breaking point?
Continuous Estimation
Firepower
Detecting targets
Searching
Identifying and prioritising targets
Classification,
Ranking
Identifying and taking down targets.
Classification,
Ranking
Is BLUE taking down targets fast enough?
Continuous Estimation
Tempo
How is the BLUE doing?
How is the RED doing?
Continuous Estimation
What is the average pace of BLUE and RED in this terrain/ situation?
Searching
Optimising the time of decision.
Optimisation
Changes in the tempo of both sides.
Clustering

The AI possible problem types are expressed in italics and mapped as probable causality for enhancement of tactical capabilities in Table 4. Moreover, there is a need to find the data that AI algorithms need for training, the information systems that AI features can be embedded, and the information security to ensure the integrity and availability of the essential data.


6.Constraints and Issues Related to Data and Information Systems

Artificial intelligence requires data, either for searching and making sense of things or learning from events. Data may be structured, time series, images, video, text or audio as long it is unbiased and exact digital description of an event or a piece of information.  Before assessing the feasibility of AI features, the architect needs to study:

  1. where data exist, 
  2. how data are accessible, 
  3. what kind of information systems live that may able to embed AI features, and 
  4. would the information security guarantee the availability and integrity of the required data? 

In seeking possible sources of data, the architect needs first to survey all related information systems, find enterprise-level records and databases, consider acquiring data from open sources, vendors, government agencies or coalition partners as presented in Figure 5.

Figure 5: Possible environments where data can be found for AI enhanced military affairs

Secondly, the architect needs to study the existing and developing information systems that are supporting the OODA-loop for potential primary systems where AI features may be embedded. Table 5 presents an example of a moderately digitised force, and it's possible information sources and systems that may be used to embed the features of AI.

Table 5: Example of possible sources of data and systems available to embed AI features through the OODA -loop

Observe
Orient
Decide
Act
Structured data
Tactical and operational sensors, Coalition, Open Source (OS), ISTAR systems
Battle Management Systems (BMS), Enterprise Resource Planning (ERP), coalition and government libraries, vendor service
BMS, ERP
BMS, ERP
Time series
Moving target indicators, event data, tracking data
Battle log’s, tracking data, Surveillance data
BMS, ERP, Combat ID
BMS, ERP, Combat ID
Images
GEO, SIGN, OS, Unmanned Vehicle Systems (UVS), Image Intelligence (IMGINT)
OS, threat libraries, vendors

UVS, IMGINT
Video
CCTV, UVS
Video libraries, Coalition, Vendors


Text
Military messaging, transactions, documents
Policies, Doctrines, Field Manuals, Standard Operational Procedures, Studies, Documents, OS, Coalition R&D
Military messaging, BMS, ERP, Emails, Documents

Audio
Communications, Acoustic sensors
SIGNINT libraries

Comms channels

Thirdly, the architect should assess the accessibility of data since military enterprises have a habit of stovepipe structures that are isolated from each other. Notably, the connectivity through the whole OODA process creates end-to-end access to data essential for the full loop. Therefore, the interoperability of Intelligence, Surveillance and Reconnaissance (ISR); Battle Management (BMS); and Enterprise Resource Planning (ERP) processes extended to significant partners provide an excellent platform for AI enhanced Command and Control (C2).

Fourthly, the architect should ensure that information security controls and measures are in place to provide data with the integrity and availability required for trusted AI features. One of the most cost-effective ways for the adversary to suppress the AI enhancement capabilities is to attack the trust between soldiers and their AI systems. The trust is lost if RED can manipulate the data content or cut the flow of data stream in the intensive situation.


6. Roadmap to AI Enhanced Tactical Command and Control – a Case Example

One can create a roadmap in Figure 6 for applying AI to enhance tactical command and control processes at the tactical level by composing the elements from the previous analysis. Tactical capabilities from Table 1 define the performance end states for the journey. Each resource year (Anno) establishes the pace of advance. Existing data, system that can embed the AI and vendors ability to do the integration determine the constraints/enablers for realistic milestones. Tactical performance establishes the priority for the possible OODA loop enhancements.

Figure 6: An example of roadmap to improve tactical combat capabilities through enhancing command and control by Artificial Intelligence


7.Summary of the Architecture Logic Applied in this Study

The study explains how an enterprise architect can analyse military affairs and assess the feasibility of using Artificial Intelligence features to improve capabilities in military force utilisation. The case study is focusing on the tactical level battle and enhancing commander’s command and control abilities using AI features in chosen tactical functions. The example provided illustrates the following analysis process of an architect for AI feasibility study:

  1. Define the system of systems and its environment to create a holistic view
  2. Defining the measurable areas of capability that require improvement in the context of the previous comprehensive systems view
  3. Defining the processes where Artificial Intelligence features may make an impact at capability level = first mapping of improved processes and areas of capabilities
  4. Defining specific functions in target process where AI can make a difference = second mapping of functions and AI specific enhancements
  5. Retracing the AI enhancements through processes back to capabilities
  6. Considering the enablers or constraints of data, information systems, connectivity and information security
  7. Creating a roadmap for AI enhancements

The study focused on analyses and expert features of artificial intelligence only. Therefore, there needs to be a similar study of the highlights of Human-Machine Interfaces, Autonomous systems and Image recognition to create a more holistic understanding of the opportunities provided by recent AI developments in military.